Photogrammetry is the measurement of objects and places from photographs. By comparing images taken from different positions, software can reconstruct the shape of a scene. With suitable reference information, the result can also be given a real-world scale and location.
In drone work, this is how a collection of aerial photographs becomes a measurable map or a 3D model. Photogrammetry mapping is used to document construction sites, measure material piles, inspect structures and record changes over time.
The idea is straightforward, but taking photographs that look good is not always enough. The software needs several clear views of the same features, and the survey needs to be planned around what you intend to measure.
How can a photograph contain a measurement?
A single photograph shows where a feature appears in the image, but usually does not give enough information to locate that feature in three dimensions. A roof corner could be close to the camera or farther away, its position in one image alone does not settle the question.
Photograph the same corner from another position and you gain another view. If the camera geometry and positions are known or estimated, the two views constrain where the corner can be. More suitable views help the software check and refine that estimate.
This is the principle behind photogrammetric reconstruction. The software finds matching features across photographs and uses their changing image positions to estimate the scene's geometry.
Imagine photographing a small building as you move around it. The front wall, roof edge and side wall become visible from different angles. A sequence of overlapping images gives the software enough connections to reconstruct those surfaces together. Photographs taken from one fixed position, even with the camera pointing in different directions, do not provide the same depth information.
Why drone surveys need so much overlap
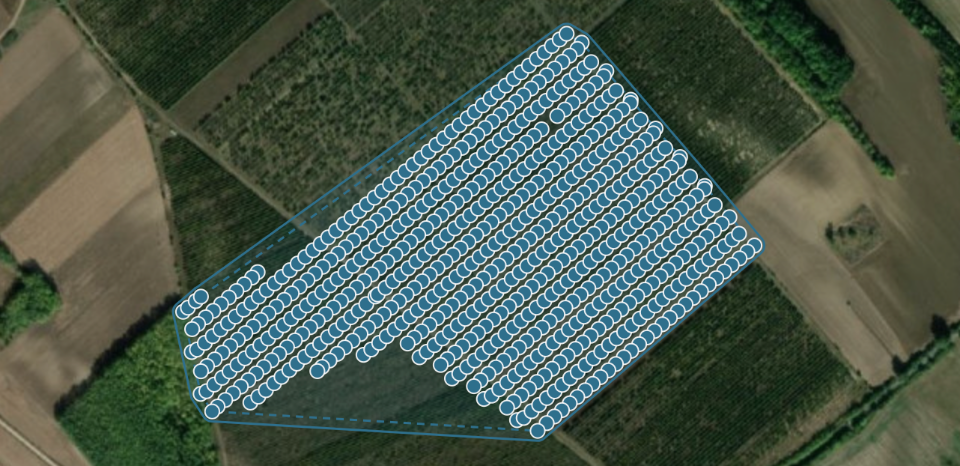
During a mapping flight, the drone takes photographs along a series of flight lines. Much of the ground appears in several consecutive images and in images from neighbouring lines.
That repetition is necessary. Without enough shared detail, the software may struggle to connect one part of the flight to another. A gap between flight lines can leave an area poorly reconstructed even if the total number of photographs seems high.
The correct capture plan depends on the subject. Open ground photographed from above is a different task from a building facade. If you need a wall in the finished model, the camera must see that wall clearly from several useful positions. Adding hundreds of photographs of the roof will not make up for missing wall coverage.
Plan for the least favourable part of the site as well. A change in terrain height affects the camera's distance from the ground, and tall structures can hide areas behind them. The article on how many photos a drone map needs explains the relationship between flight height, overlap and image count.
What photogrammetry mapping produces
The same photo set can support several outputs. Which ones you need depends on the work, and not every survey requires all of them.
An orthomosaic map is a corrected aerial image assembled from the photographs. It gives you a detailed overhead view for horizontal measurements and site documentation. The image contains colour information, it does not itself provide a height value for every pixel. See what is an orthomosaic?.
A point cloud represents the reconstructed scene as many individual 3D points. It is useful for inspecting geometry and continuing work in compatible survey software. The points are estimates derived from the photographs, with accuracy that depends on the capture and reconstruction.
Elevation models represent height on a grid. A surface model includes roofs, vegetation and other visible objects. A digital terrain model estimates the ground after non-ground features have been filtered out. The distinction matters for jobs such as drainage and earthworks, it is explained in orthomosaic, DSM and DTM.
A mesh represents surfaces using connected polygons, usually triangles. With photographic texture, it can be useful for presentations and visual inspection. Whether a point cloud or mesh is more suitable depends on what the recipient will do with it. The comparison in point cloud or 3D mesh covers the practical differences.
Specialist sensors can provide additional information, such as multispectral or thermal data. Those measurements are not recovered from ordinary RGB photographs simply by selecting another output.
A practical example: measuring a material pile
Suppose a yard manager needs the volume of a gravel pile. Photogrammetry can reconstruct the visible pile surface, while the orthomosaic helps the operator identify its boundary.
The volume calculation then compares that surface with a base underneath it. Depending on the site, the base might come from a previous survey of the empty yard or an appropriate fitted surface. The quality of that choice matters alongside the quality of the photographs.
This example shows why processing the photos is only part of the job. A well-reconstructed pile can still produce a poor volume estimate if the boundary includes machinery or the assumed base is wrong. The operator needs to inspect the result and record how the measurement was made.
The stockpile volume workflow takes this example from flight planning through to delivery.
What equipment do you need?
For a conventional photographic survey, you need a camera capable of producing sharp images and a way to capture the required viewpoints. A drone is useful for covering a site from above, but photogrammetry is also used with handheld cameras and cameras mounted on other platforms.
The processing software must suit both the data and the deliverable. When comparing photogrammetry software for drones, check supported image types, georeferencing options, available outputs and how the results can be exported.
For work that must match a site grid or meet a specified accuracy, you also need suitable reference and verification measurements. These may require additional survey equipment and expertise. A camera and a processing subscription alone do not establish survey accuracy.
MapperTool's capture guidance describes the imagery expected by the platform. Check those requirements before capture, especially if you intend to use images from a camera or workflow you have not tested before.
How accurate is it?
There is no useful accuracy figure that applies to photogrammetry in general. The result depends on the image detail, viewing geometry, camera calibration, scene and reference information, among other factors.
It also matters which kind of accuracy you need. A model may represent the shape of a pile reasonably well while being offset from the site's coordinate grid. That offset might have little effect on a volume calculated entirely within the model, but could make the same data unsuitable for positioning a new structure.
Resolution is another separate question. A sharp orthomosaic can reveal small features without placing them equally accurately in world coordinates. Quoting the pixel size as the survey's accuracy confuses two different measurements.
For work with an accuracy requirement, plan independent checks. Points used to fit a model are not independent evidence of how well it matches positions that were not used in the fit. Read drone survey accuracy explained.
Where the method struggles
Photogrammetry works best when the same stable surface detail can be recognised across several images. Some subjects make that difficult:
Water and reflections. The visible pattern can move or change with the viewpoint, so it may not correspond to a fixed surface feature.
Plain surfaces. A featureless wall or a large uniform patch can provide too little detail for reliable matching.
Moving subjects. Vehicles, people and wind-blown vegetation can appear in different positions during the flight.
Hidden areas. Ground under a closed canopy or a surface behind a wall may not be photographed at all.
Blurred or poorly exposed images. Detail visible on site may be missing from the photographs used for processing.
A completed model can contain holes, noise or interpolated surfaces in these areas. Inspect the parts that matter to the job rather than judging the entire survey from a distant overview.
Where the camera cannot see the required surface, another method may be more suitable. Ground measurements or an appropriately planned laser survey may be needed. Choosing a higher processing setting does not create a new observation of hidden ground.
Planning your first project
Choose a manageable site with visible, textured surfaces and a clear reason for mapping it. Decide what you want to produce before flying: an overhead map, a terrain model, measurements or a 3D record of a structure.
Make sure the capture covers those requirements. Photograph the area from useful viewpoints, preserve the original images and their metadata, and check the dataset for blur or gaps while another flight is still possible.
After processing, inspect recognisable features at close range. Look for missing surfaces, doubled edges and unexpected distortions. Compare relevant measurements with independently known information, and keep a record of any limitations that affect the result.
When choosing aerial photogrammetry software, use that same representative dataset to assess whether the output is usable for your task. A visually attractive model is encouraging, but the important test is whether it supports the work you intended to do.
A short glossary
Term | Meaning in a drone survey |
|---|---|
Photogrammetry | Recovering measurements and geometry from photographs |
Overlap | The part of the scene shared between photographs |
GSD | Ground sample distance: the ground size represented by an image pixel |
Tie point | A scene feature identified across multiple images and used to connect them |
Georeferencing | Relating the reconstruction to a real-world coordinate system |
Ground control point | A point with known coordinates used to constrain the model |
Checkpoint | An independently measured point reserved for evaluating the result |
Orthomosaic | A geometrically corrected, assembled map image |
Point cloud | A collection of reconstructed positions in three dimensions |