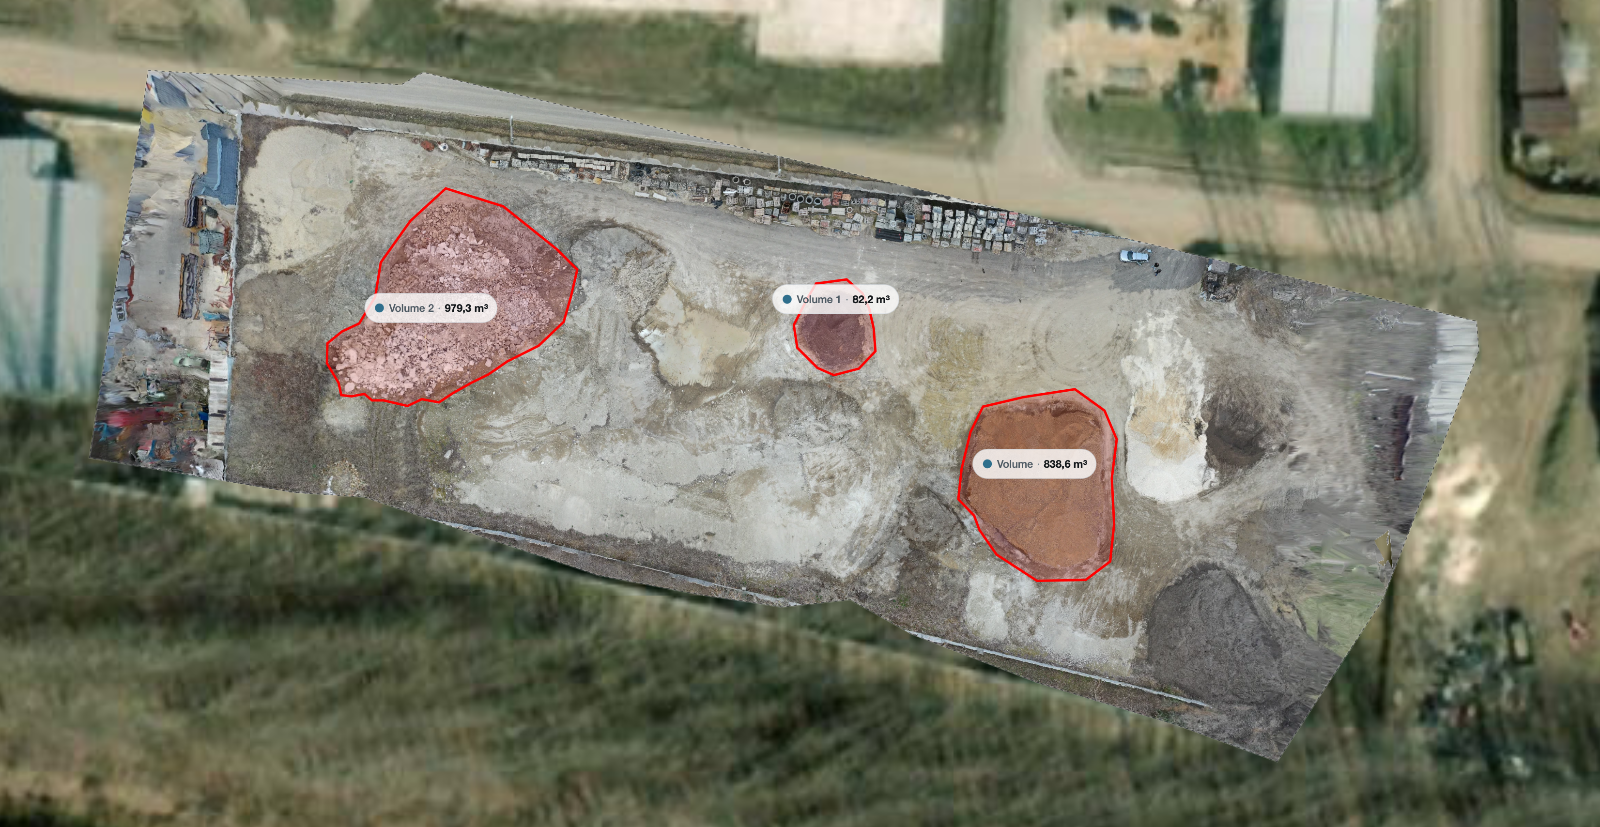
A stockpile volume is one of the few drone deliverables where the client can immediately tell whether you were wrong. The number goes into a stock report or a month end reconciliation, and if it disagrees with the last one by fifteen percent, somebody will ask why.
The workflow itself is short and repeatable: the flight takes a few minutes, the processing runs on its own, and the measurement comes down to three decisions. Almost all the error lives in two of them, and both are under your control.
Key takeaways
The boundary you draw at the toe of the pile is the largest single source of error.
The base surface matters as much as the flight. A best fit plane, a terrain model and a flat assumption give different answers.
Fly a buffer well beyond the pile, and add a second grid at an angle for steep or tall piles.
Volumes from repeat flights are only comparable if the flight and the boundary are handled the same way each time.
Five minutes before you fly
Walk the pile first. You are looking for three things.
Where the toe is. The point where the pile stops and the yard begins is where you will draw the boundary later, and on a well used pile it is not obvious from above: spillage and tracked material blur it.
What is on the pile. A loader parked halfway up, a conveyor or a tarp all become part of the surface model, and therefore part of the volume. Move what can be moved, and note what cannot.
What the base looks like. Flat concrete, compacted gravel with a slope, or a bay with retaining walls on three sides? This decides the base method later, and it is easier to answer on site than from a screen.
The flight
Standard mapping settings work, with two adjustments for piles.
Situation | Flight | Why |
|---|---|---|
Low, broad pile in an open yard | Single nadir grid, 80 percent forward, 70 percent side | The top down view sees everything |
Tall or steep sided pile | Nadir grid plus a second grid rotated 90 degrees, or camera tilted 15 to 20 degrees | Steep faces are poorly seen from straight above |
Pile against a wall or in a bay | Add an orbit around the accessible sides | Recovers the faces the grid misses |
Several piles in one yard | One flight covering the whole yard with a generous buffer | Gives a common base for all of them |
Two rules apply every time: fly a buffer well past the toe, since you need clean ground around the pile to define the base, and keep the flight height constant relative to the yard, not the take off point, on a sloped site.
Overlap and flight height planning is covered in how many photos does a drone map need. A single medium pile is typically a flight of a few minutes and a photo set in the low hundreds.
Upload and choose the outputs
Volume work needs elevation, so request the digital surface model as well as the orthomosaic: the boundary is measured against the DSM, and the base plane is fitted from the elevations around its own perimeter. Request the terrain model too on a sloped yard, so you can compare bare ground against the surface model as a check on that base. The distinction between the two is set out in orthomosaic vs. DSM vs. DTM.
The orthomosaic is not optional either, even though it holds no height: you need it to see where the toe actually is when drawing the boundary, and the client needs to see that you drew it in a sensible place.
Run the pile through and measure it in the browser
Upload the photos, request the orthomosaic and elevation models, then draw the boundary and read the volume in the viewer. The free plan takes up to 150 photos per project.
Upload the flightDrawing the boundary
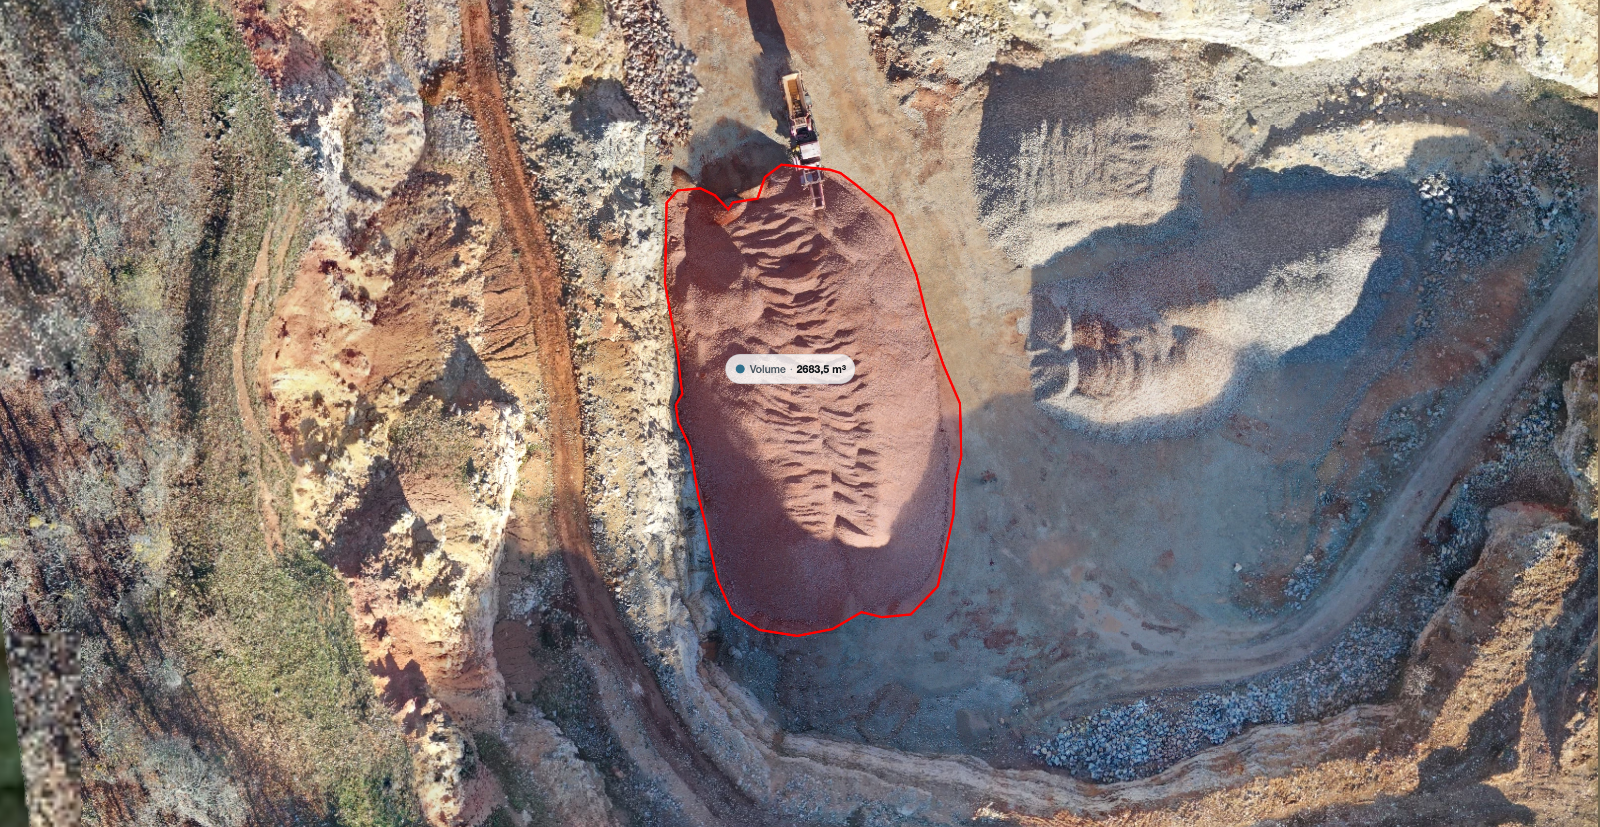
This is the step that decides your number. Open the orthomosaic, zoom in until individual pixels of the toe are visible, and trace the boundary where the material actually stops.
Two failure modes push the result in opposite directions: drawing wide adds a thin wedge of air and inflates the volume, while drawing tight cuts off the shallow skirt of material that carries a surprising share of the tonnage.
The perimeter is where the pile is thinnest, so each error there is small, but the perimeter is long: a systematic 30 centimetre bias around a large pile adds up quickly, and repeats every time somebody redraws the boundary.
Choosing the base surface
The volume is the space between the top surface and a base. Which base you pick is a real decision, not a formality.
Base option | Use it when | Watch out for |
|---|---|---|
Best fit plane through the boundary | The yard around the pile is flat or evenly sloped | A single high or low point on the boundary tilts the plane |
Terrain model under the pile | The ground is uneven, or the pile sits in a hollow | The bare earth under the pile is interpolated, so it is an estimate |
A previous survey of the empty yard | The base was captured before material arrived | Only valid if nothing under the pile has changed since |
Fixed elevation | Concrete pad or a bay with a known floor level | A wrong level shifts the whole volume linearly |
A best fit plane through the drawn boundary is the sensible default for a pile in an open yard, and it is what most tools compute automatically. The measurement reports material above the plane as cut and material below it as fill: on a clean pile the fill figure should be small, and a large one usually means the boundary strayed into a hollow or a loader trench.
Read the coverage warning
If part of the area inside your boundary has no reconstructed surface, those cells are left out of the sum rather than filled in. A tool that reports a partial coverage percentage is telling you something important: at 92 percent covered, the missing 8 percent contributes nothing to the total, and if that gap sits on the peak the shortfall is not small. Reflying is the answer, not a footnote.
Sanity checks before you send it
Four checks take a minute and catch nearly every embarrassing result.
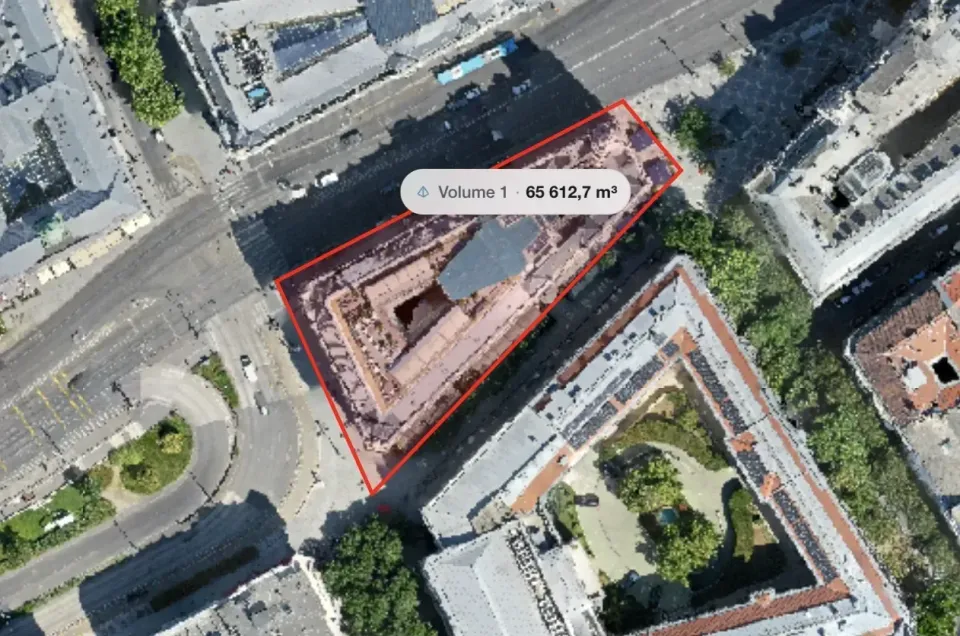
Does the shape look right? Look at the pile in 3D or a hillshaded elevation view. A sharp spike, a hole in the crest or a flat lid usually means poor reconstruction, not real geometry.
Is the base plausible? Toggle the surface and terrain models and confirm the difference between them is near zero on the yard and rises smoothly onto the pile.
Does the number agree with the site? Multiply a rough footprint by a rough average height and compare to the reported figure: a cone 30 metres across and 8 metres high is roughly 1900 cubic metres. If the tool says 12,000, check the units, the base and the boundary.
Is it consistent with last time? If material has not moved, two surveys should agree closely. A difference of more than a few percent with no deliveries in between is in your method, not in the yard.
Delivering the result
Send three things: the volume with its units, a boundary picture, and one sentence on how the base was defined. That sentence makes the number defensible six months later, when nobody remembers which method was used.
If the client wants to check it rather than take your word for it, a read only link lets them open the map, toggle layers and see where the boundary sits. How links, roles and expiry work is covered in sharing a drone map with a client.
Be equally clear about accuracy: a stockpile volume depends on relative accuracy within the model, usually good, rather than absolute position, which without ground control usually is not. That distinction is explained in drone survey accuracy explained.
Frequently asked questions
How accurate is a drone stockpile volume?
On a well flown pile with a clean boundary and a sensible base, differences of a few percent against a traditional survey are typical, and repeat measurements of an unchanged pile should agree even more closely. The dominant error is method, not equipment: boundary placement and base choice move the number far more than the drone does.
Do I need ground control points for stockpile volumes?
Usually not. The pile and its base sit inside the same model, so a shared position offset cancels out of the volume. Ground control matters once the volume must tie to a coordinate system, be compared against someone else's survey, or be checked against a fixed base elevation from an external source.
Can I measure a pile that is against a wall or under a conveyor?
Partly. Faces the camera never sees have to be interpolated, and a conveyor over the crest occludes the highest-volume part of the pile. Add oblique passes on every accessible side, and tell the client which portion was reconstructed rather than inferred.
How often should a stockpile be flown?
That depends on the reporting cycle: monthly is common for stock reconciliation, weekly where material moves fast. Whatever the interval, keep it consistent: same flight height, same overlap, same boundary, same base method. Consistency is what turns a series of measurements into a trend.
Stockpile volumes reward discipline more than equipment. Fly a buffer, request the elevation outputs alongside the orthomosaic, draw the boundary carefully at the toe, choose a base you can explain in one sentence, and check the result against a rough estimate before it leaves your desk. Do it the same way every month, and the trend line is worth more than any single number on it.