A drone survey can show where a solar farm needs closer attention, from an unusually hot cell to a panel behaving differently from the rest of its row. Across a large site, the real benefit is being able to place each finding on a map and return to the right panel for inspection.
Thermal maps reveal temperature differences. RGB imagery provides the visible detail needed to understand the location and its surroundings. Used together, they give an inspection team a much clearer starting point than either layer alone.
MapperTool brings these layers into a workflow that now includes Solar Inspect, its new module for automatic panel recognition, fault flagging, manual review and report creation. Before using that analysis, though, it is worth getting the survey itself right.
Decide what the inspection needs to answer
An operator investigating a drop in production may already know which part of the plant is affected. A routine inspection needs broader coverage, while a follow-up visit may concentrate on previously reported panels. The purpose affects the flight plan, the detail required and the information the maintenance team needs afterwards.
Capture the thermal and RGB views of the same site
For panel inspection, the array should be operating under suitable sunlight. Variable cloud and strong wind can change the thermal contrast during the flight, making panels captured at different times harder to compare. Record the operating conditions and discuss any disconnected sections with the site operator. FLIR's solar inspection guidance explains why irradiance, wind and cloud cover matter.
Plan for the detail in the thermal camera, rather than judging everything from the sharper RGB preview. A survey intended to identify a cell-sized feature needs enough thermal detail to represent that feature. Being able to distinguish the outline of a panel is a less demanding task.
The two datasets should cover the same panels and represent the same inspection period. A thermal finding from one visit and a visible image from a different season can create unnecessary uncertainty about shadows, soiling or changes on site.
In MapperTool, RGB and radiometric thermal photographs can be uploaded together in one project to produce both an RGB orthomosaic and a thermal map. Radiometric imagery retains temperature information; a coloured thermal preview alone is insufficient. The thermal processing guide explains the input requirements.
Read solar maps at two scales
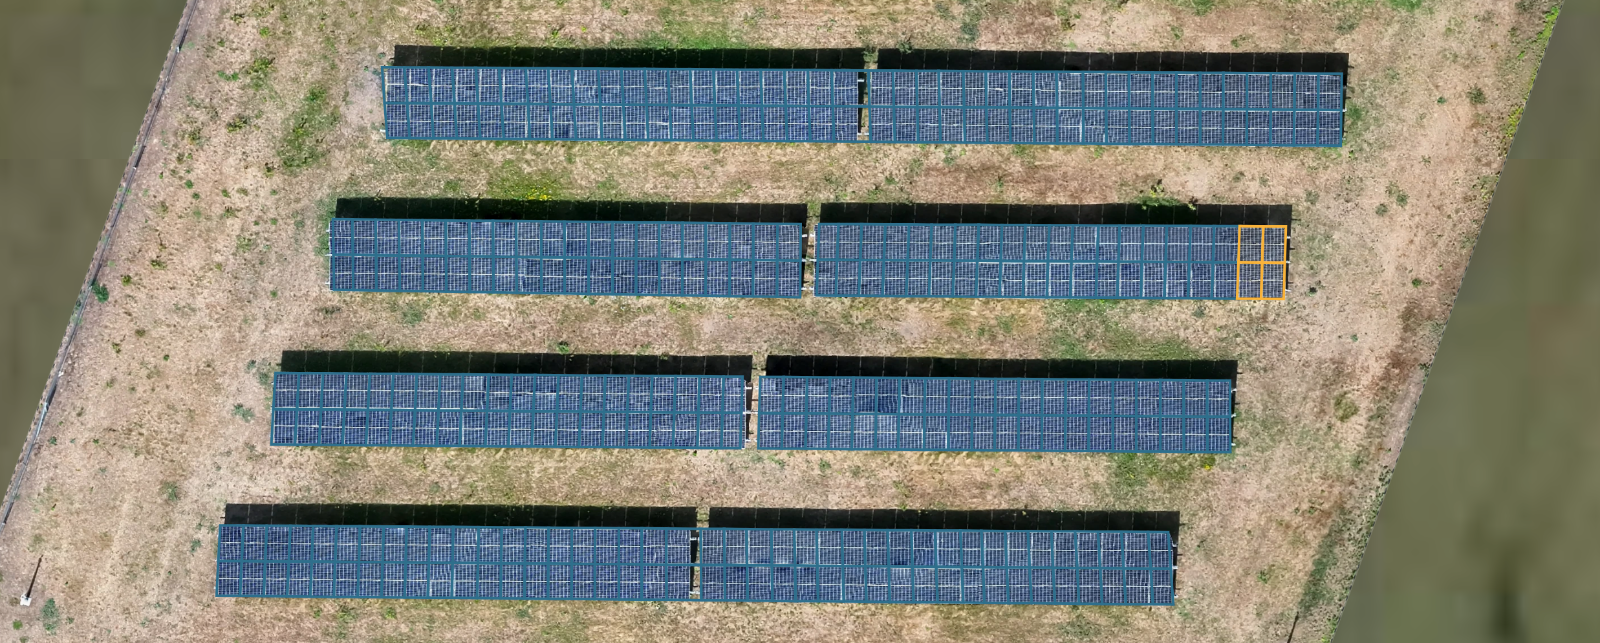
Start with an overview of the whole site. Look for missing coverage, changes between flight sections and areas that differ from their surroundings. Then inspect individual panels and compare them with nearby panels under similar conditions.
An orthomosaic map is particularly useful here because the rows remain in their geographic context as you move between the overview and the detail. The access road, row ends and neighbouring blocks help you keep track of where a finding sits. If you are new to this output, our guide to what an orthomosaic is explains how it differs from an ordinary aerial photograph.
For inspection, solar maps should help answer a practical question: which parts of this installed array deserve closer examination? That is a different use from mapping how much sunlight a proposed site might receive.
A small hot area within a panel
A localised hot spot may relate to shading, soiling or a cell problem. Check the RGB view for visible context before deciding what the thermal pattern means. A leaf or patch of dirt and a damaged cell may call for different follow-up work, even if both produce a conspicuous warm area.
A larger area or an entire panel standing out
Record whether the pattern occupies one part of the panel or extends across it. Compare the finding with adjacent panels, keeping differences in exposure and operating state in mind. Describe what is visible before assigning a cause: “whole panel warmer than its neighbours” is a useful observation even when the underlying electrical issue still needs confirmation.
A pattern affecting several panels
When neighbouring panels show similar behaviour, review them together as well as individually. Bring the operator's electrical layout into the discussion rather than assuming that adjacent panels must belong to the same circuit. This is where a broad site view helps a reviewer see relationships that are easy to overlook in isolated images.
Use automatic detection to organise the review
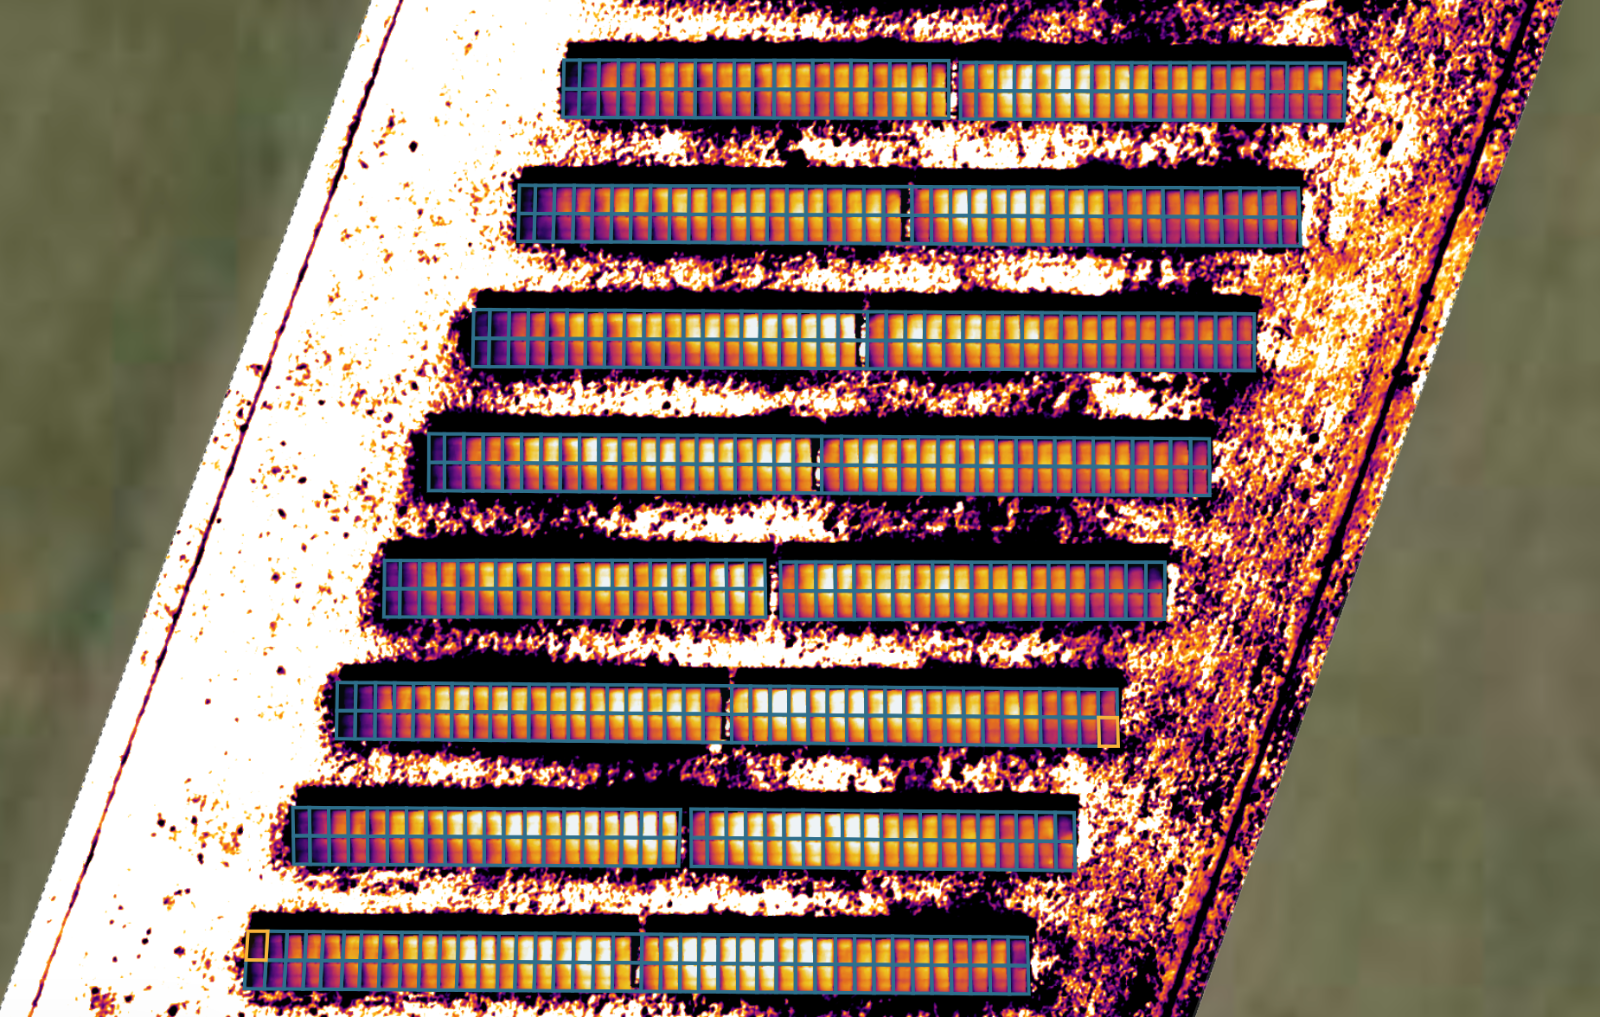
On a large solar farm, manually working through every row is repetitive. MapperTool Solar Inspect automatically recognises panels and flags suspected problems, including temperature outliers and patterns associated with cell or panel faults. This gives the reviewer specific panels to examine in the context of the full survey.
Every panel can then be examined individually in the software. During manual review, you can mark a panel as faulty or Clean, redraw its outline, delete an incorrect detection or add a panel that was missed. That combination is valuable at scale: automation supports the initial examination, while the reviewer can correct the results before preparing the report.
Solar Inspect requires both a thermal orthomosaic and an RGB orthomosaic and is available exclusively to Pro subscribers. Use High when processing a project for the module. MapperTool's quality guide explains that High uses the best resolution available in the source imagery. Good capture remains essential because processing cannot recover a cell detail that was never recorded.
Make the findings useful to the maintenance team
The report should allow someone who did not fly the drone to understand the findings. Alongside the results, provide the inspection date, the surveyed area, relevant operating conditions and any limits in coverage. Where a suspected fault needs a ground check, make that next step clear.
Solar Inspect lets you create a PDF report, helping you turn the reviewed inspection into a deliverable. The accompanying explanation should distinguish observations from confirmed diagnoses. A temperature anomaly can justify further investigation without implying that the panel must immediately be replaced.
For repeat visits, retain enough information about capture conditions to interpret changes. A panel appearing warmer on a later survey does not, by itself, show that its condition has deteriorated if sunlight, wind or loading also changed.
If you already work with drone imagery, Solar Inspect adds panel analysis and reporting to that survey workflow. Start your project in MapperTool, prepare the thermal and RGB orthomosaics using High processing, and use a Pro subscription to review the array with Solar Inspect.
Find the plan that fits your workflow
Start free, explore the full workflow, then choose the plan that matches your projects.
View plans