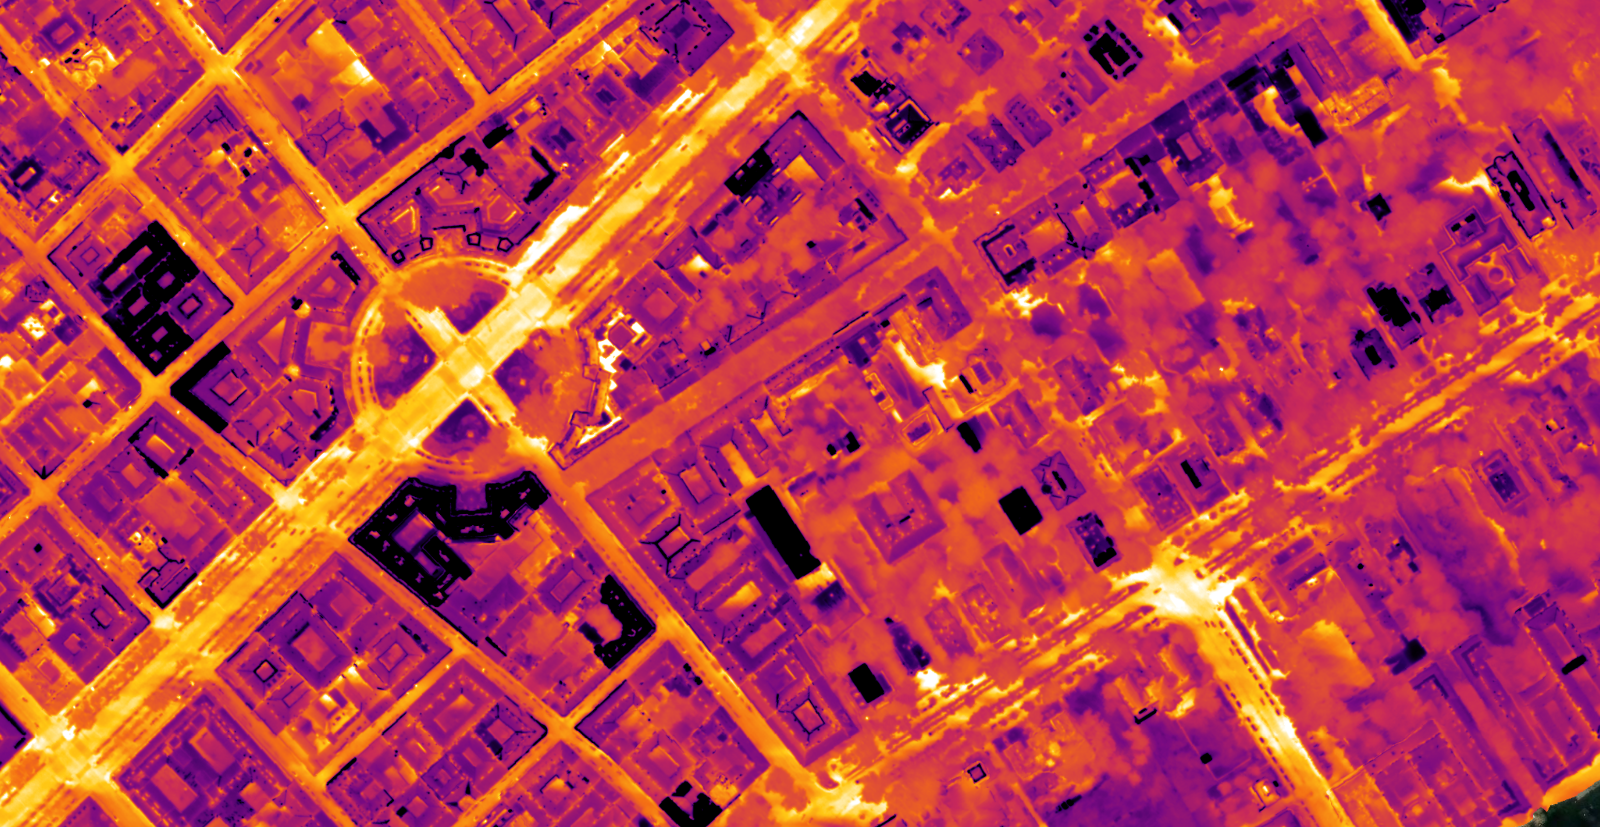
Thermal work splits into two jobs that look similar and share almost nothing.
One is a building envelope. The site is small, the target is a wall you can point at, and the whole difficulty is interpreting what a surface temperature implies about what sits behind it. The other is a solar farm, where the physics is simpler but the site is forty hectares of identical rows, and the value is entirely in knowing which of twelve thousand modules the warm one was.
Both rest on the same few quantities, and both are ruined by the same few conditions.
Key takeaways
A thermal camera measures the apparent temperature of the outermost surface, and nothing behind it.
Emissivity and reflected apparent temperature are inputs you set, not properties the camera discovers.
Solar farms want clear midday sun under load. Building envelopes want the opposite, after dark in the heating season.
Thermal transmittance is inferred from surface behaviour over time. It is never read off a frame.
The quantities people mix up
Four terms get used as if they were the same measurement. They are not.
Apparent surface temperature is what the camera reports. It is the temperature of the outermost surface, calculated from the radiation arriving at the sensor, and it says nothing directly about anything behind that surface.
Emissivity, written as a value between 0 and 1, is how efficiently a surface radiates compared to a perfect emitter at the same temperature. A low emissivity surface radiates weakly, so the camera reads it as colder than it is.
Reflected apparent temperature is everything the surface is bouncing back at you. A clear sky is radiatively very cold, so a reflective surface pointed at it reads cold regardless of its own state.
Thermal transmittance, the U value, is how much heat passes through a building element per square metre per degree of difference. It is a property of the construction, expressed in W/m²K, and no infrared camera measures it.
Emissivity and reflected temperature are values you enter when converting the raw frames. Get them wrong and the map is still internally consistent, but every absolute number on it is wrong by an amount that depends on the material.
Surface | Typical published emissivity | Effect on the reading |
|---|---|---|
Bare or polished metal | 0.05 to 0.20 | Reads far colder than it is, and mirrors its surroundings |
Painted or oxidised metal | 0.60 to 0.95 | Usable, but varies with the coating and its age |
Glass, viewed close to perpendicular | 0.85 to 0.95 | Reliable near nadir, unreliable at a shallow angle |
Concrete, brick, render, plaster | 0.90 to 0.95 | Well behaved, the easy case |
Bitumen, roofing felt | 0.90 to 0.97 | Well behaved, but stores a lot of daytime heat |
Water and wet surfaces | 0.95 to 0.98 | High emissivity, but evaporation cools the surface independently |
Take the value from the material data or your camera manufacturer's table rather than a general list, and note which value you used in the report. It is the most common reason two surveys of the same asset disagree.
One angle effect outweighs all of it. Glass behaves like a mirror as the viewing angle moves off perpendicular, and beyond roughly 45 to 60 degrees its reflectivity climbs sharply. That is the physical reason a panel survey is flown nadir.
Why a camera cannot measure insulation
Thermography detects surface temperature anomalies. Insulation performance is an inference drawn from them, and the inference needs three things the camera does not supply.
A temperature difference across the element. No difference, no heat flow, nothing to see. For a building that means the heating season and a real gap between inside and outside.
Time. Fabric has thermal mass. A wall that sat in the sun until an hour ago is still releasing that energy, and the pattern you photograph belongs to the afternoon rather than to the construction.
Steady conditions. Wind strips heat from exposed surfaces unevenly, and a gusty flight produces streaks that read as structure.
What thermography does well is find where heat is escaping and where it is not, which is usually the actual question. Three mechanisms produce three different signatures.
Conduction through a thermal bridge gives continuous, geometrically regular bands. Slab edges, lintels, balcony connections, structural columns. The shape follows the construction, not the weather.
Air leakage gives irregular plumes that fan out from joints and penetrations, and they move with pressure. Same building, windy day, different picture.
Moisture gives patches that are cooler while evaporating and warmer once saturated material starts holding heat. This is where surveys most often go wrong, because a wet patch and a missing insulation patch can look alike in a single frame.
Solar farms: conditions and fault signatures
The physics here is straightforward and the difficulty is scale.
When to fly. Panels only reveal faults under electrical load, so this is a clear midday job, with the array near its potential and no broken cloud. Keep the wind light, because moving air flattens the differences you are trying to see. Fly nadir, and fly the site in one session: irradiance drifting across ninety minutes shows up as a gradient that belongs to the weather.
What you are looking at. Fault signatures are patterns, not values, and the pattern tells you where in the chain the problem sits.
One whole module warm and uniform across the whole array of cells. Usually a disconnected or open circuited module, or a connection problem upstream of it.
One third or one half of a module warm, in a clean rectangular block. A bypass diode has activated, which means the substring behind it is shaded, damaged or failing.
A single hot cell, distinctly warmer than its neighbours. Localised shading, soiling, a crack or a defective cell. Persistent single hot cells are the ones that turn into failures.
A gradient across many cells, often warmest at the edge of the module and cooling towards the centre. Potential induced degradation and cell mismatch produce patterns like this.
A warm junction box with the panel itself normal. A connection or terminal fault, and worth flagging with urgency because it is a fire risk rather than a yield problem.
A whole string reading cold and uniform while its neighbours are warm. Nothing is generating there, so look at the inverter or the string protection rather than at the panels.
There is an IEC technical specification covering outdoor infrared thermography of photovoltaic plants. Read it before your first report for a client with an asset manager.
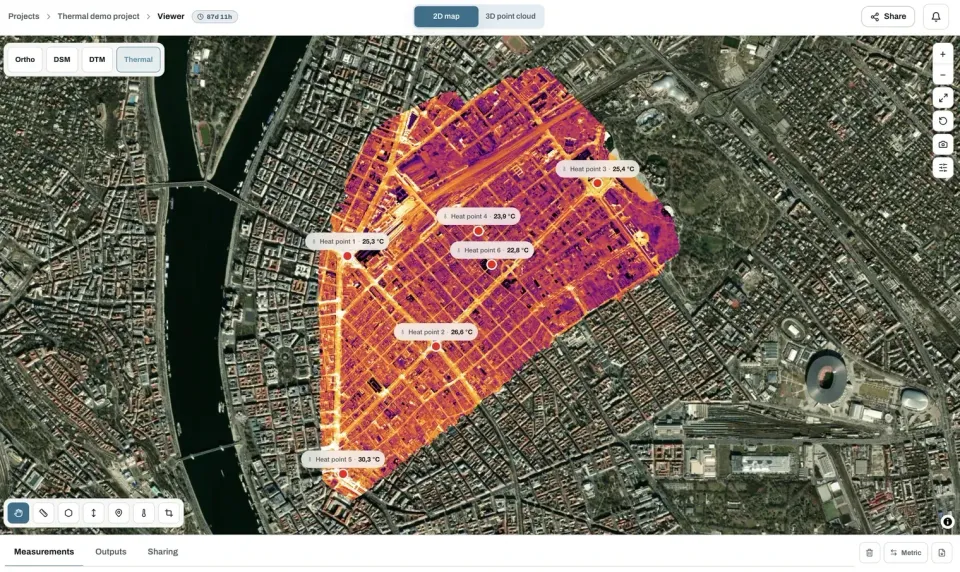
Why the map, and not the frames. On a small roof a thermal frame is easy enough to place by eye. On a forty hectare site, every row looks like every other row, and a folder of three thousand frames showing a warm module is not an actionable finding. Mapped, the same warm module has coordinates, sits in a numbered row, and goes into a work order. That is the entire argument for processing rather than reviewing.
Map the whole site, not the frames
Upload the converted thermal set and get one continuous layer you can point at. The free plan takes up to 150 photos per project.
Start a projectBuilding envelopes: the opposite conditions
Everything that makes a good solar flight makes a bad building flight.
Factor | Solar farm | Building envelope |
|---|---|---|
Season | Any, needs irradiance | Heating season, real inside to outside difference |
Time of day | Around solar noon | After sunset, or before dawn |
Sun | Wanted, the array must be loaded | Avoided, recent sun loading ruins the reading |
Wind | Light | Light, and it matters more |
Wet surfaces | Avoid | Avoid, evaporative cooling mimics heat loss |
Camera angle | Nadir | Nadir for roofs, oblique for facades |
The other difference is the reference. A solar array gives you thousands of identical objects under identical conditions, so a comparison is built in. A building gives you one object, and any conclusion depends on comparing like with like: the same material, the same orientation, the same exposure. Comparing a south facing render panel against a north facing one and calling the difference a defect is the classic error.
What ruins a survey
Two more, both avoidable. The first is flying for the visible camera rather than the thermal one. Thermal sensors carry far fewer pixels than the RGB camera beside them, so a height that suits one leaves the other too coarse to resolve a single cell.
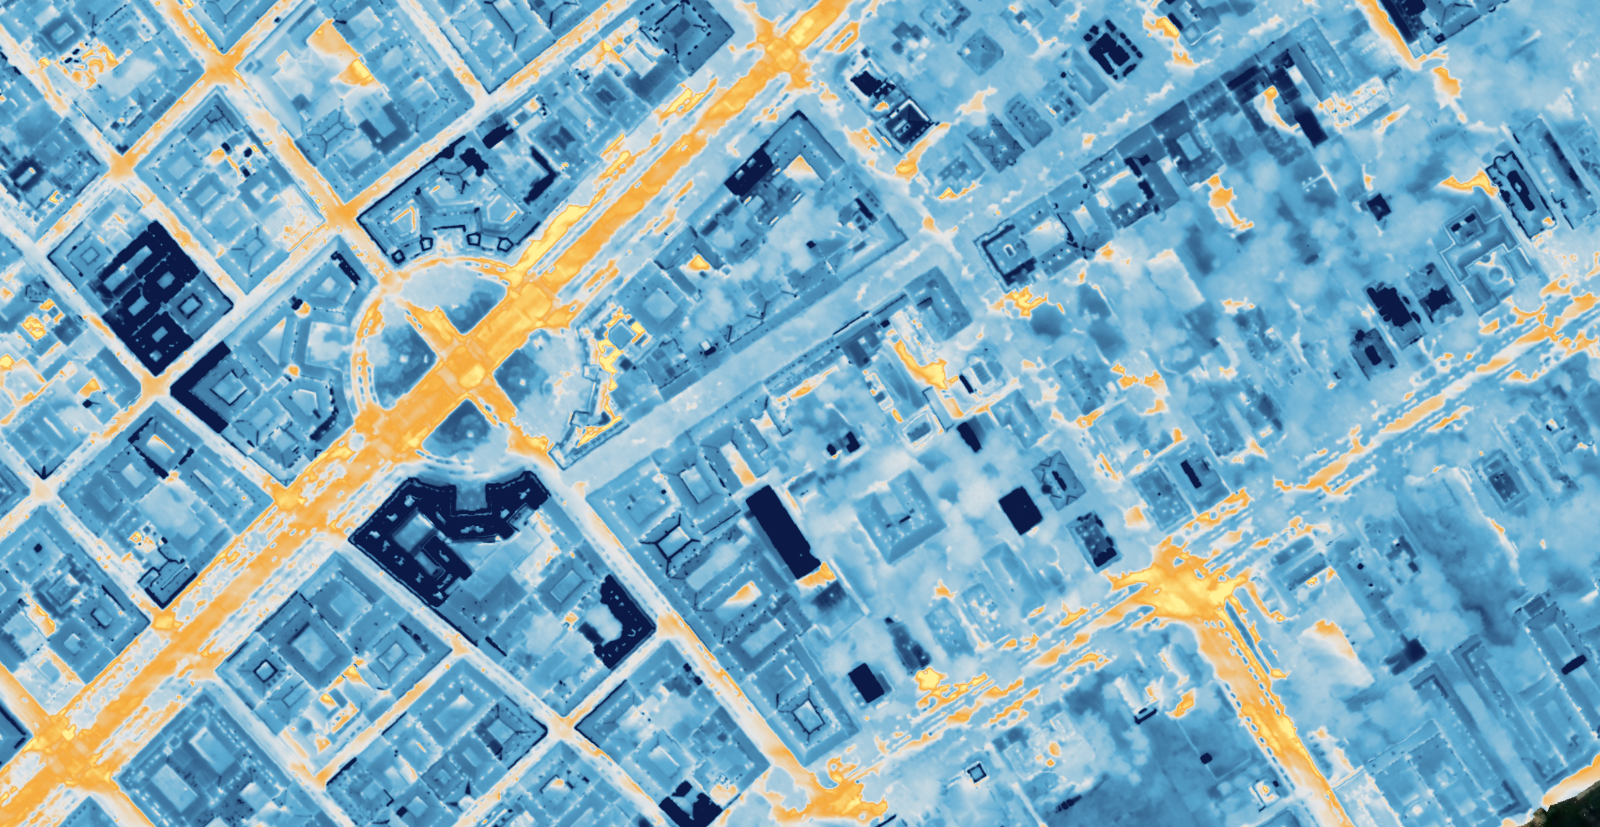
The second is treating a palette as a measurement. A colour scale with numbers beside it looks authoritative whether or not the underlying file holds temperature values at all. If the frames were never converted to calibrated temperature data, the map ranks warm and cool correctly and the numbers mean nothing.
What goes in the report
Six items, and the first three are what separate a professional deliverable from a set of pictures.
Conditions at the flight: date, time, ambient temperature, wind, cloud, and for solar work the production state of the array.
The emissivity and reflected apparent temperature used in the conversion, per material where they differ.
Whether the values are calibrated temperature or relative only, in one sentence.
The findings, each with a location, the signature it matches, and a severity.
The visible orthomosaic alongside the thermal layer, so anyone can see what the warm shape physically is.
What you could not assess, and why. Panels under cloud shadow, a facade you could not reach, an area flown as conditions changed.
Deliver the thermal layer as a single band GeoTIFF if it is going into anyone else's software, and say what the value range represents.
Frequently asked questions
Can I calculate a U value from a thermal survey?
Not from imagery alone. Thermal transmittance is measured with heat flux plates and paired temperature sensors over a period of days, under stable conditions. Thermography locates where to place them and shows where the fabric is not performing as designed, which is a different and usually more useful job.
Why does my solar survey show whole rows as cold?
A uniformly cold string generally means it is not generating at all, so look upstream at the inverter or the string protection rather than at the modules. Check also whether that part of the site was under cloud shadow when you flew over it, which produces the same appearance for a completely different reason.
What emissivity should I use for solar panels?
Panel glass sits in the high band, and manufacturers or your camera's material table will give you a specific figure. What matters more than the exact value is flying close to nadir, because glass reflects strongly at oblique angles and no emissivity setting compensates for that.
Can one flight cover both thermal and visible imagery?
Yes on a dual sensor aircraft, and it is worth doing because the visible layer is what makes the thermal findings locatable. Plan the height for the thermal sensor, since it is the coarser of the two, and accept more images than a visible only survey would need. What the visible layer contributes is covered in [what is an orthomosaic](/blog/what-is-an-orthomosaic).
Two numbers decide whether a thermal survey is worth flying at all, and both are known before you leave: the temperature difference driving the heat flow, and the wind. If there is no difference to drive anything, or the wind is stripping the surface unevenly, the flight will produce a map that looks exactly as convincing as a good one.