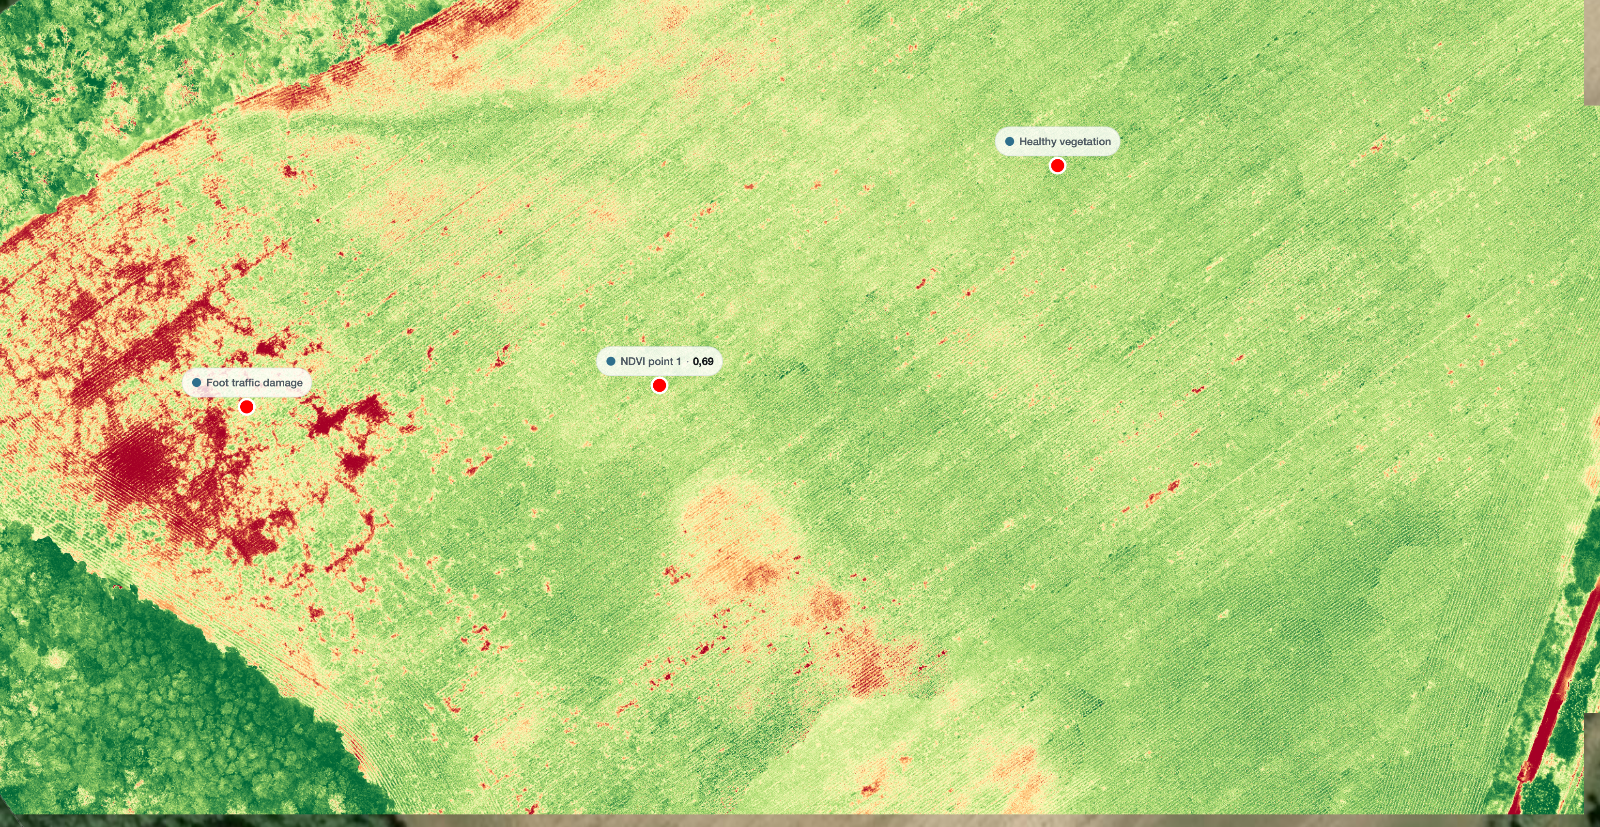
From the road the field looks fine. Two weeks later a corner of it is visibly behind the rest, and by then the cause has had a fortnight to spread.
An NDVI map is one of the few tools that closes that gap. It responds to changes in canopy condition before they are obvious to the eye. What it also does, if you skip a step, is produce a colourful picture that nobody can act on and nobody can compare to last month.
Key takeaways
NDVI needs a near infrared band, which means a multispectral sensor and not an ordinary camera.
Calibration is what makes two flights comparable. Without it you have a snapshot, not a trend.
Fly for the multispectral sensor, which is much lower resolution than the camera beside it.
An index value tells you where to look. It does not tell you what is wrong.
What NDVI measures, and what it does not
Healthy vegetation absorbs most of the red light that reaches it and reflects a large share of the near infrared. Stressed vegetation does less of both. NDVI compares those two bands and returns a single number per pixel, high where that contrast is strong and low where it is weak.
That is the whole idea. It is a measure of how vigorously the canopy is reflecting, and it is genuinely useful because that signal changes earlier than colour does to the human eye.
This is not a diagnosis. A low value means less healthy canopy in that pixel, and the cause can be water, nutrition, compaction, disease, a machine track or bare soil showing through a thin stand. The map narrows the search. It does not end it.
The sensor is the whole decision
A multispectral sensor captures discrete bands through separate filters, including a near infrared band that an ordinary camera cannot see at all. Without that band there is no NDVI, only a visible light index that behaves differently and cannot be compared against agronomic thresholds.
Two consequences follow, and both matter more than people expect.
The first is resolution. A multispectral sensor has far fewer pixels than the RGB camera sitting next to it on the same aircraft. If you plan the flight around the camera, the index bands come back too coarse for the detail you wanted.
The second is the light sensor. Many multispectral systems include an upward facing irradiance sensor that records the incoming light while you fly. It matters because cloud passing overhead changes what reaches the canopy from one pass to the next, and without a record of that the index drifts with the weather.
Calibration, or why May cannot be compared to June
This is the step that separates a map you can act on from a map you can only look at.
Raw sensor values are not reflectance. They depend on exposure, on the light available at that moment, and on the sensor itself. Calibration converts them into a physical quantity that means the same thing on every flight.
In practice that means two things. Photograph the calibrated reflectance panel before and after the flight, at the height and in the way the manufacturer specifies. And keep the irradiance sensor unobstructed and level for the duration.
Skip calibration and you still get a map. The values on it are internally consistent, so the worst patch is still the worst patch. What you cannot do is say that this field is at the same level it was last month, because the two numbers were produced under different light.
Flying for a usable index map
Four choices decide whether the flight produces something workable.
Time of day. Fly near solar noon, within a couple of hours either side. Low sun angles lengthen shadows inside the canopy, and shadow reads as stress that is not there.
Cloud. Stable conditions are what you want, either clear or evenly overcast. Broken cloud is the worst case, because the light changes between passes and shows up as banding across the finished map.
Overlap and height. Plan for the multispectral sensor, not the RGB one. Its narrower field of view means the same flight lines give you less overlap than you think, and index maps of uniform crop are exactly the case where a weak reconstruction shows.
Repeatability. If this is a series rather than a one off, write down the height, the overlap, the time of day and the flight lines, then reuse them. Comparability comes from keeping the variables still.
Process your multispectral set
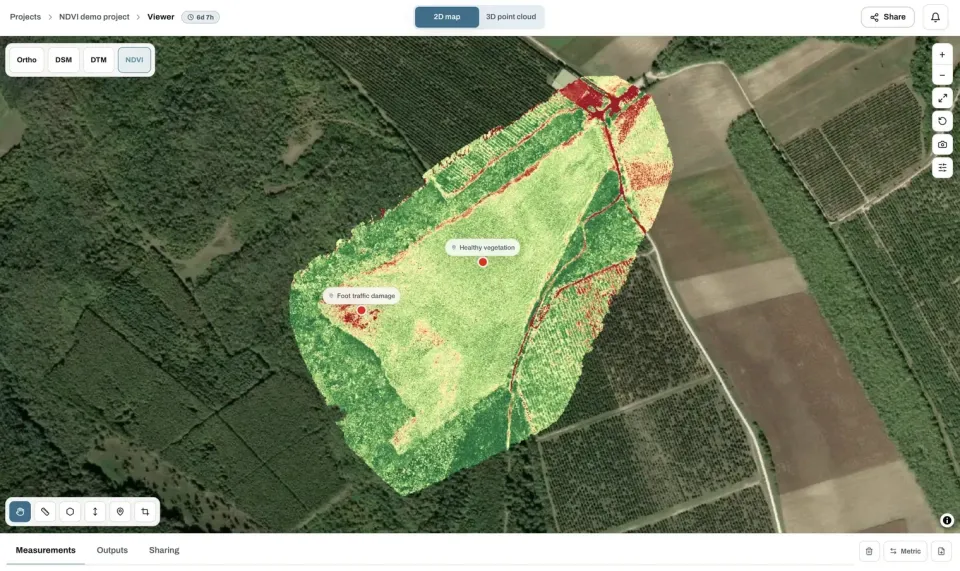
Upload the calibrated images and get the index map alongside the ordinary orthomosaic. The free plan takes up to 150 photos per project.
Upload drone photosReading the map without over-reading it
An index map invites confident conclusions. Four things are worth checking before you draw one.
What you see | What it might actually be |
|---|---|
A low patch with a straight edge | A machine track, a headland turn or a sprayer miss, not a plant problem |
A low area early in the season | Bare soil between rows showing through a thin canopy |
Uniformly high values across a dense crop | Saturation, where the index stops separating good from very good |
Banding across the field | Changing light during the flight rather than a pattern in the crop |
A low strip along the boundary | Edge effect, shading from a hedge or tree line |
Saturation deserves its own note. Once a canopy closes, NDVI flattens out and stops distinguishing between healthy and very healthy. In a dense mid season crop the map can look uniform while real differences exist underneath it. That is a property of the index, not a fault in the survey.
Frequently asked questions
How often should I fly the same field?
Often enough that a change shows before it is visible from the road, which for most arable crops in the growing season means every one to three weeks. What matters more than the interval is flying under similar conditions each time, so the differences you see belong to the crop.
Can I skip the reflectance panel if I have an irradiance sensor?
The irradiance sensor handles changing light during the flight. The panel anchors the whole set to a known reflectance. Using both is what makes flights comparable across dates, and the panel step costs a minute.
Why does my NDVI map look flat in mid season?
Most likely saturation. Once the canopy closes, the index stops separating healthy from very healthy, and the map goes uniform. At that stage other indices are more informative, and ground checks matter more than the map.
Can I use NDVI for a variable rate prescription?
Only from calibrated data, and only with ground truth behind it. An uncalibrated map ranks areas within one flight, which is not the same as a value an application map can act on. Get the calibration right first, then build the relationship on your own fields.
Before the next multispectral flight, decide whether you are producing a snapshot or the first point in a series. If it is a series, the panel, the fixed flight parameters and the written record of both stop being optional, because everything the map is worth over the season depends on the second flight being comparable to the first.